コード
source(here::here("_setup.R"))
library(ggplot2)
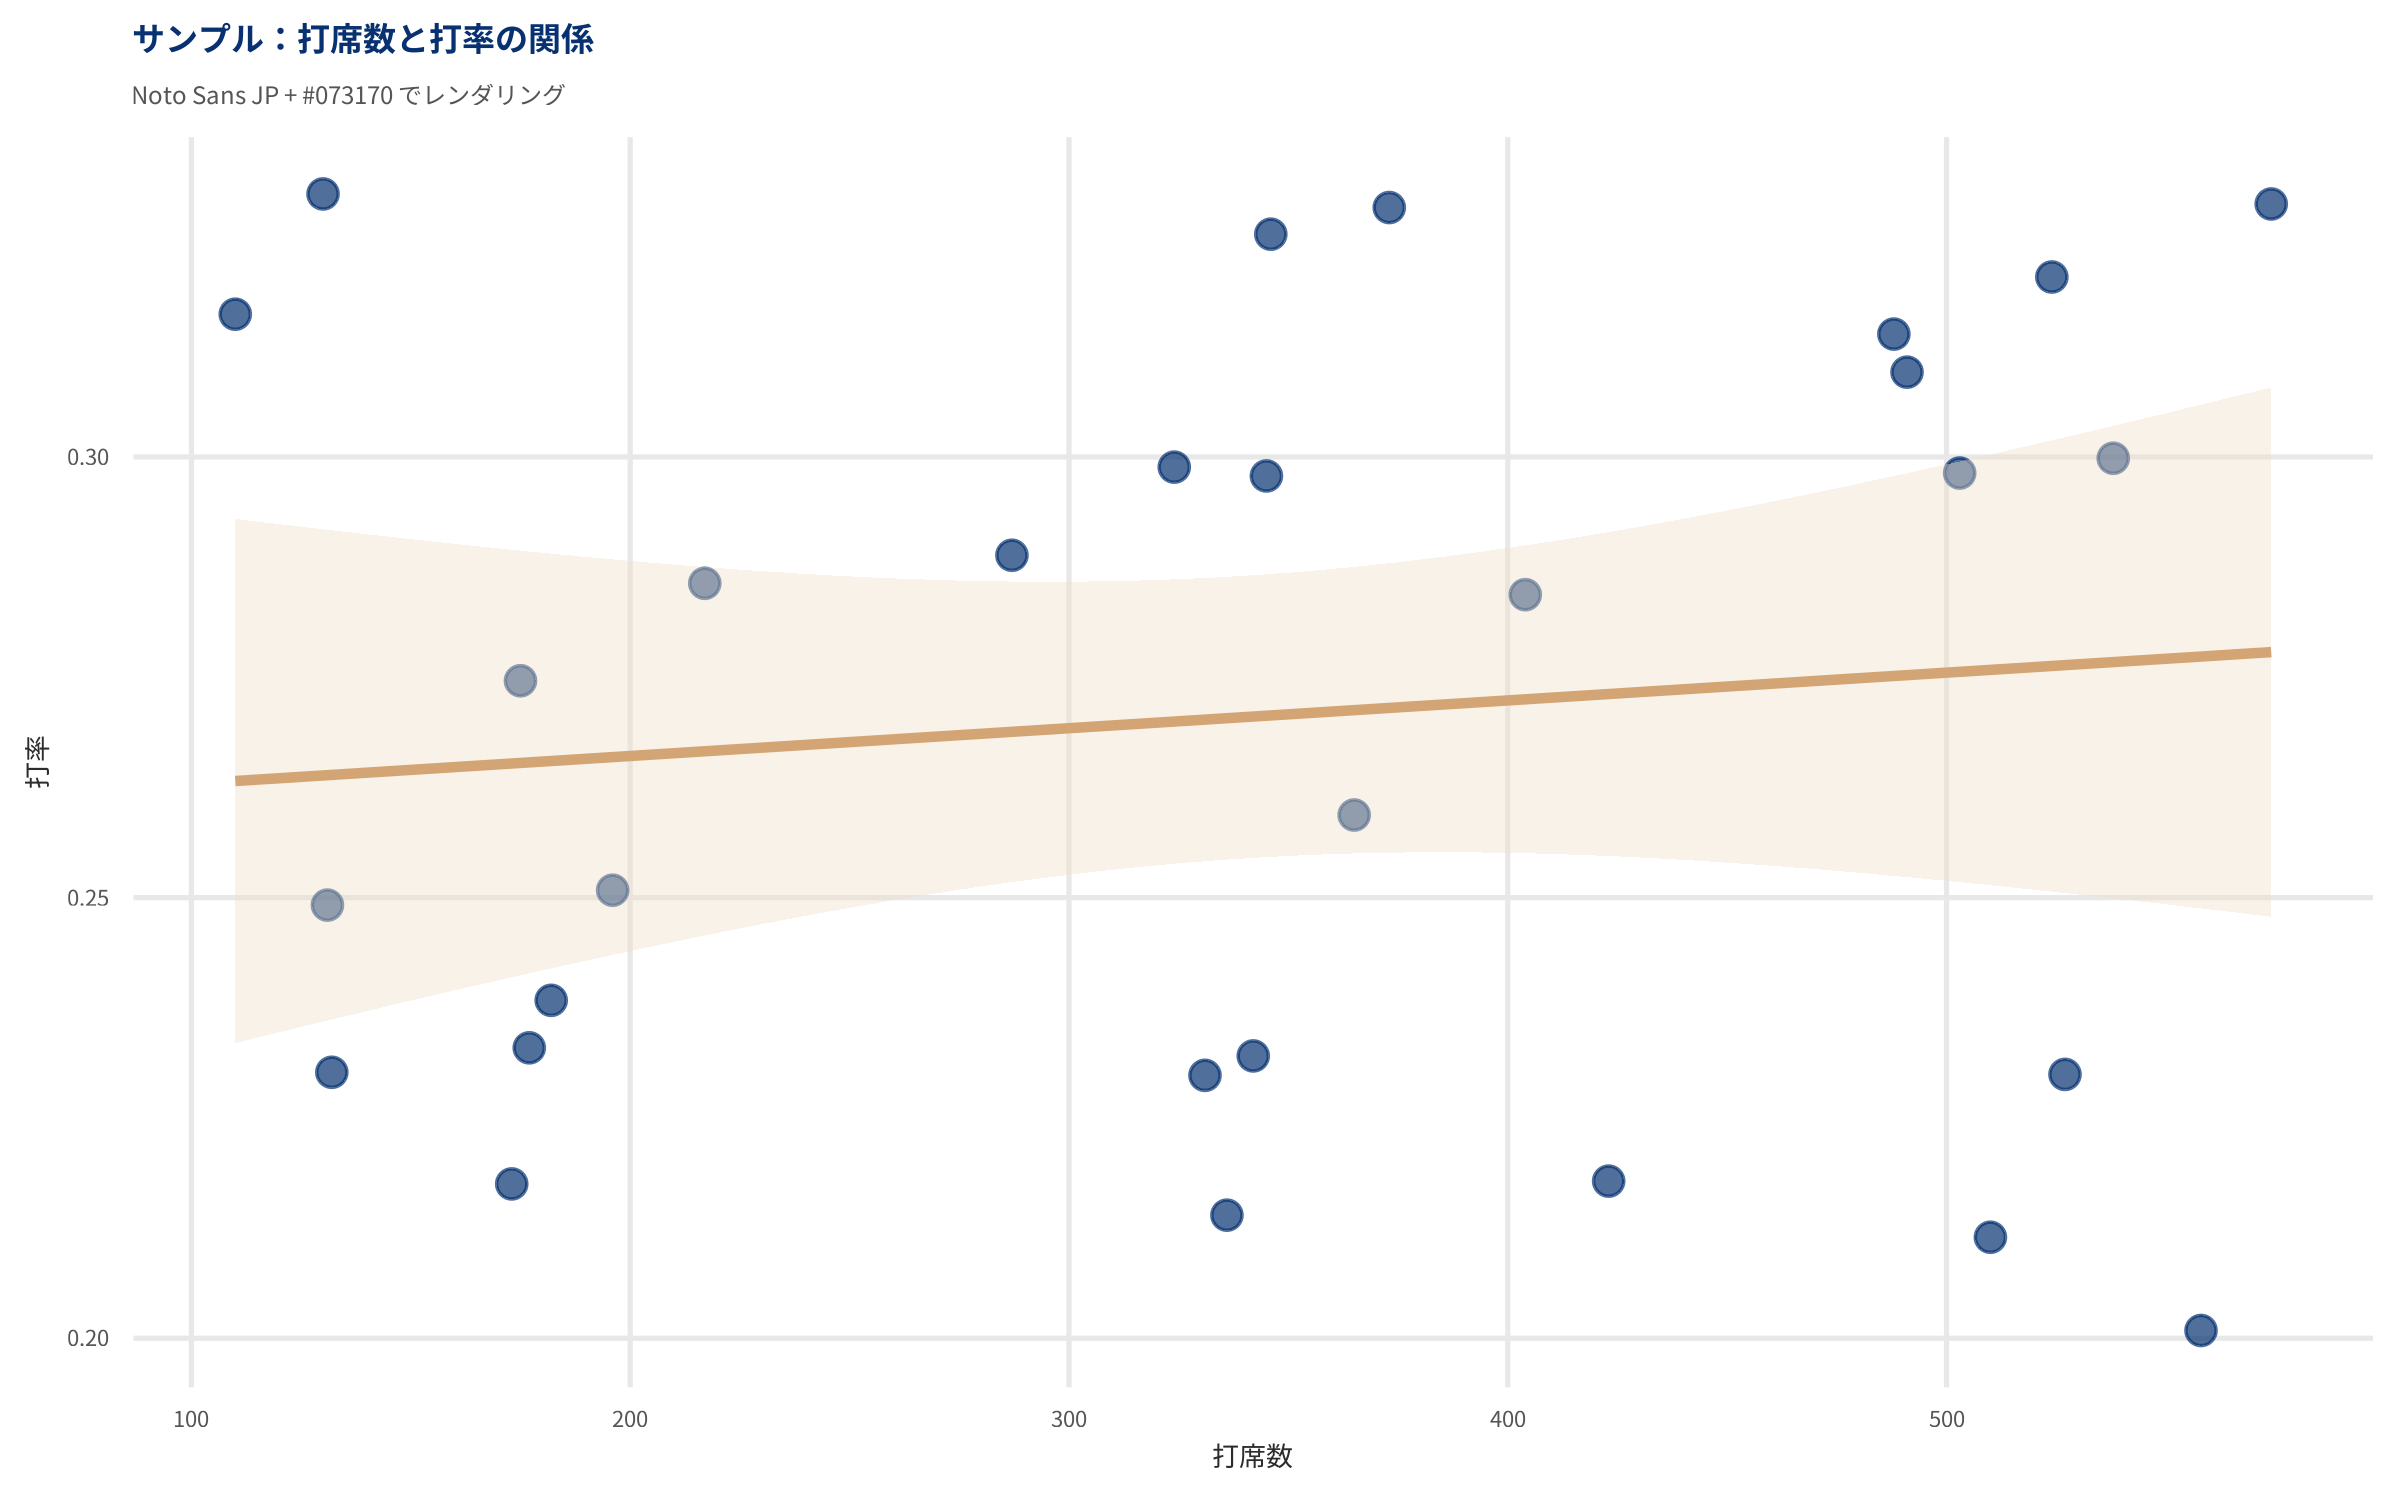
# サンプル:日本語ラベル付きの散布図
sample_data <- data.frame(
打席数 = sample(100:600, 30),
打率 = runif(30, 0.200, 0.330)
)
ggplot(sample_data, aes(x = 打席数, y = 打率)) +
geom_point(color = SB_BLUE, size = 3, alpha = 0.7) +
geom_smooth(method = "lm", color = "#d4a574", se = TRUE, fill = "#f0e0c8") +
labs(
title = "サンプル:打席数と打率の関係",
subtitle = "Noto Sans JP + #073170 でレンダリング",
x = "打席数",
y = "打率"
) +
theme_solving_baseball()